Collecting research is only half the job—what comes next is what turns raw data into real product impact. In the Data Analysis & Reporting phase of UX process, the goal is to extract meaning from everything gathered during discovery: interviews, surveys, observations, stakeholder input, and more.
Done well, this phase bridges the gap between research and execution. It helps teams prioritize what matters, identify recurring user needs, and translate findings into decisions that shape product design, inform UX/UI direction, and validate early proof of concept work.
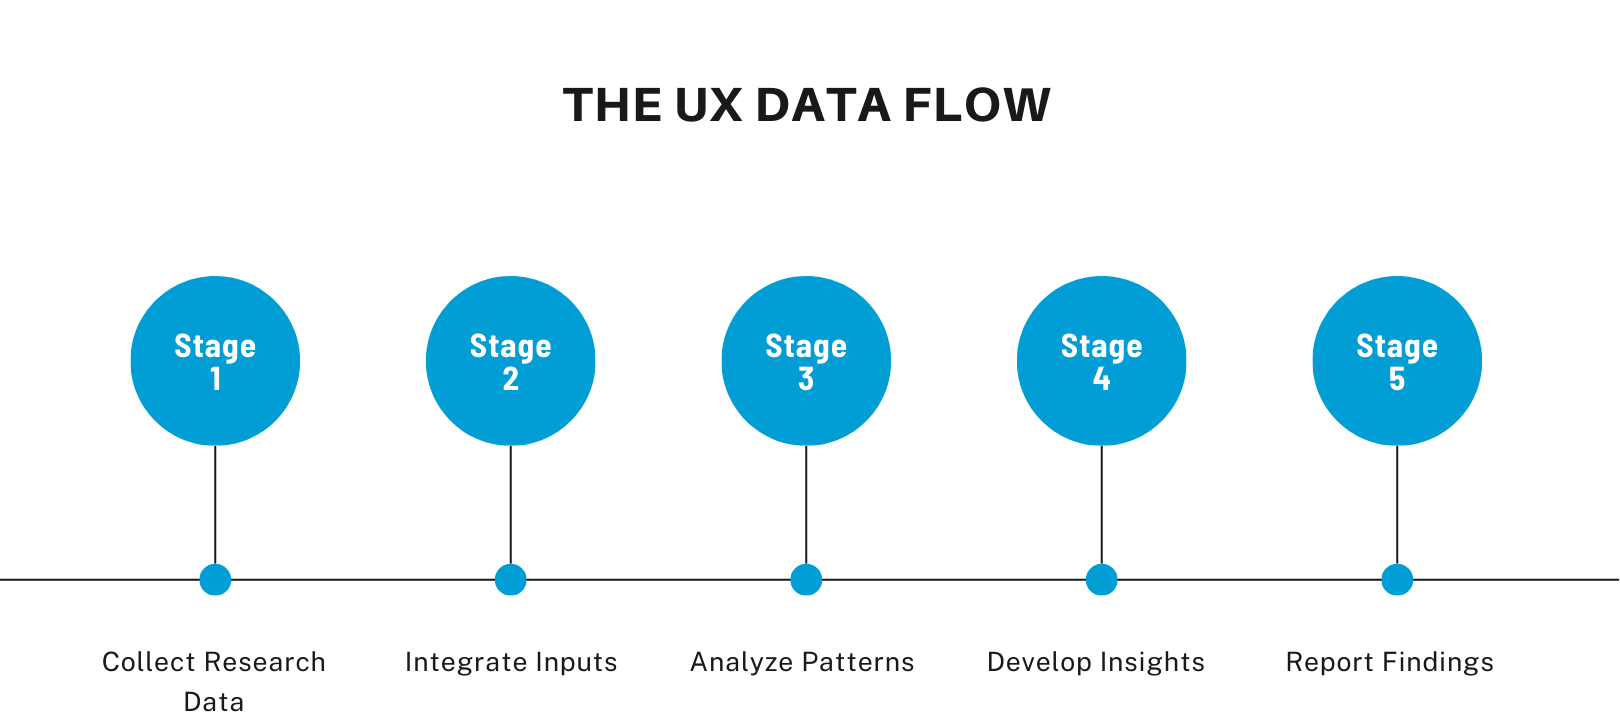
This article outlines how to structure the analysis process, merge different types of data, develop actionable insights, and report findings clearly, so they become a shared, strategic foundation for what comes next.
Integrating Insights
UX research often produces a mix of qualitative and quantitative data—interview notes, survey scores, usability observations, analytics, and maybe even stakeholder feedback. The challenge isn’t collecting more; it’s making sense of what you already have. That’s where integration begins.
This step is about merging fragmented data sources into a cohesive picture. For example, you might notice a recurring comment in interviews about a confusing onboarding step. If your survey data shows a corresponding drop-off rate at that same point, you’ve found a validated pattern worth prioritizing.
A well-integrated insight balances narrative and numbers. Qualitative inputs explain the “why,” while quantitative ones highlight scale and severity. Tools like spreadsheets, collaborative whiteboards, or even tagging systems in Notion can help structure this synthesis.
This isn’t about forcing consensus—it’s about finding where patterns align, where they diverge, and how both sides contribute to a deeper understanding of user needs. We touched on source diversity in our discovery phase article; this is where that groundwork starts to pay off.
Executing Data Analysis
With inputs aligned, the next step is actual analysis: turning scattered observations and metrics into structured, decision-ready insight. This is where patterns are named, pain points are grouped, and opportunities begin to surface.
In practice, this means identifying themes across qualitative feedback—what users say, feel, or do consistently. Methods like empathy mapping, thematic clustering, or tag-based sorting help organize feedback into categories like “navigation issues,” “missing features,” or “workflow inefficiencies.” If you’re working with quantitative data, look for spikes, drop-offs, or correlations tied to these same categories.
The key here is consistency over perfection. You don’t need formal UX research tools to do good analysis—simple frameworks in tools like Google Sheets, or even physical sticky notes, can do the job as long as your tags, logic, and terminology are aligned.
Avoid jumping to conclusions too early. One strong comment does not equal a trend. Look for recurring behaviors or frustrations across multiple sources—that’s where real insight lives. These clusters will later evolve into design recommendations, feature priorities, or hypotheses worth testing during product design and early prototyping.
Developing Actionable Insights
Not every finding from your research needs to make it into the product backlog, but the right ones should. That’s why this step is about identifying which insights are actionable and shaping them into a form that can actually drive design or development decisions.
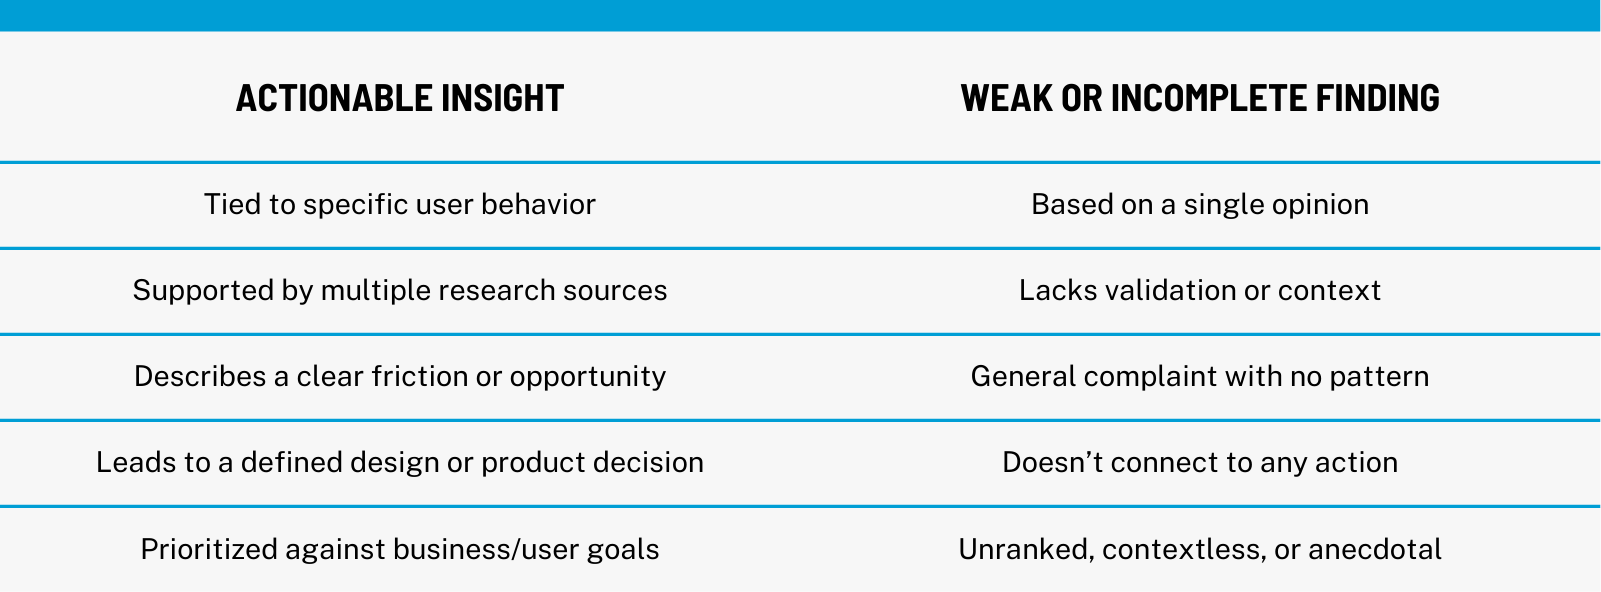
An actionable insight is typically:
- Rooted in observed or reported user behavior
- Validated by more than one source or method
- Connected to a business or product outcome
For example:
Finding: “Users often skip the onboarding tooltips.”
Why it matters: Confirmed via interviews and session recordings.
Actionable insight: “Simplify the tooltip hierarchy and delay non-critical tips until after task completion.”
Good insights often lead directly to design hypotheses or prioritized recommendations. They become inputs for wireframes, testable features in a proof of concept, or UX design improvements rolled out in the next iteration.
This is also the point where cross-team conversations begin. Sharing insight summaries with product owners, developers, or QA leads helps ensure the findings are usable, not just interesting. Our UX Research Strategy article expands on how to create a shared understanding.
Effective Reporting
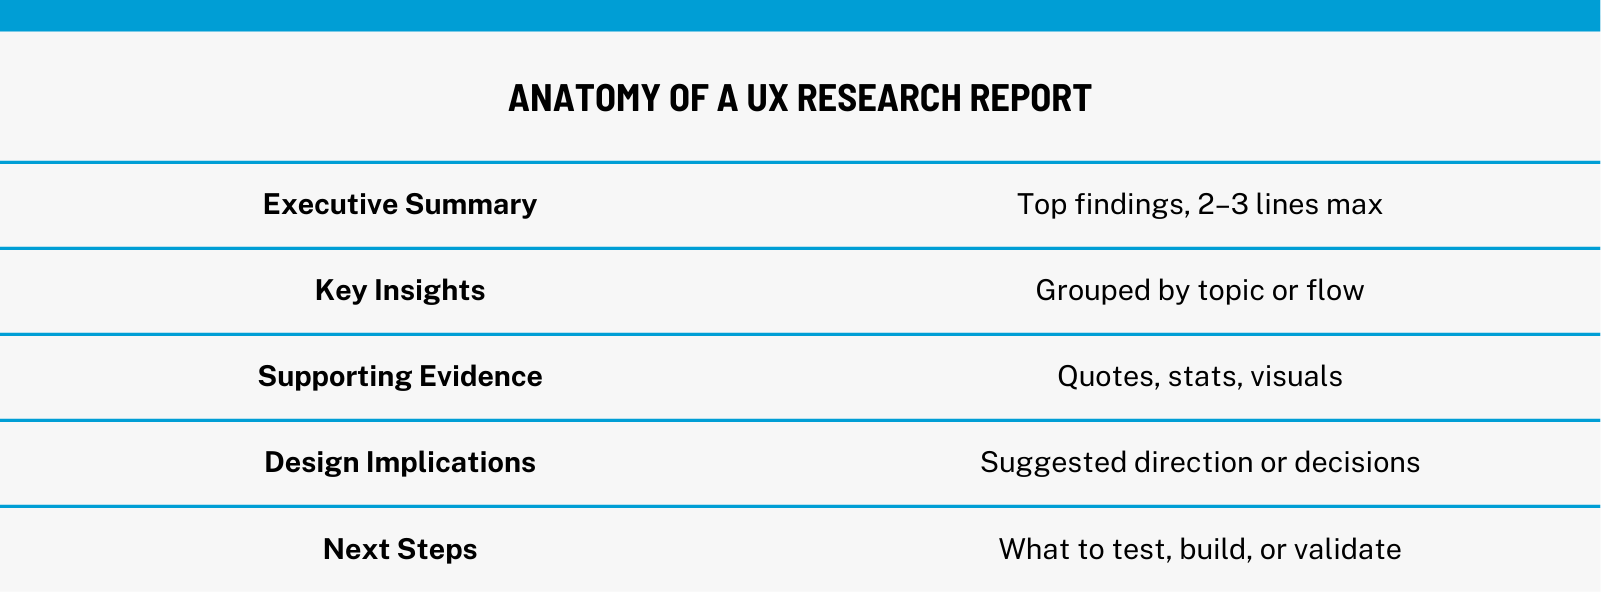
The final step in UX data analysis isn’t just handing over findings—it’s communicating them clearly, so they’re actually used. A good report doesn’t overwhelm with every detail you collected; it distills the key insights, shows where they came from, and connects them to design and product decisions.
Structure matters. Start with a short executive summary or top findings section. Then break insights into logical categories—by feature, flow, or user need. Use charts, quotes, or short bullet lists to make the content scannable. If certain data backs up specific design decisions, include annotations or visuals that connect the dots.
Tailor the format to the audience. A slide deck might work for leadership, but your design team may prefer a Notion page or FigJam board. Developers might want structured pain points and requirements dropped directly into a task tracker.
The goal is always the same: make insights usable. Not just readable, but ready to be acted on across UX/UI design, product planning, and sprint execution. We talk more about handoff formats and design artifacts in our Discovery Phase guide, where this step feeds directly into design execution.
The Takeaway
UX research doesn’t create value until it’s understood, synthesized, and applied. That’s why data analysis and reporting are more than administrative steps—they’re the turning point where raw input becomes informed action.
By integrating diverse sources, structuring findings with care, and communicating clearly, teams can move forward with confidence. The insights generated here shape everything that follows: design hypotheses, feature priorities, and the overall product direction.
Whether you’re feeding into early product design, validating assumptions in a proof of concept, or preparing for a new design sprint, this phase ensures that you’re not just working hard—you’re working with focus.